
Ticker Details
When you click a ticker in the results list, the center panel displays a full analysis: key metrics, market data, a funding rate chart, and a rate table across all exchanges.
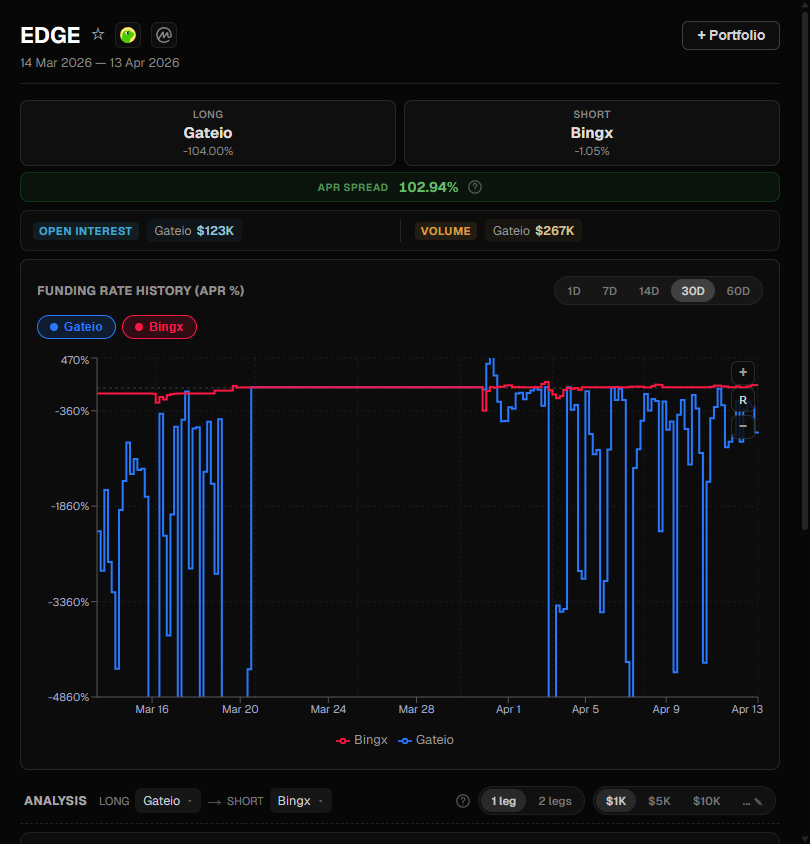
Header
The header displays:
- Symbol name with a clickable favorite star
- Coin links — direct links to CoinGecko and CoinMarketCap pages for the token (if available)
- + Portfolio button — add the ticker to your portfolio with the best exchange pair pre-filled
Period Label
Below the header, the analyzed time period is displayed: "DD MMM YYYY — DD MMM YYYY", showing the exact date range of the current analysis.
Metrics
The metrics section shows the key performance indicators for the selected ticker:
| Metric | Description |
|---|---|
| Total Spread | Cumulative spread (%) between the best exchanges over the selected period |
| Long | Best exchange for the long side + APR (annualized percentage rate) |
| Short | Best exchange for the short side + APR (annualized percentage rate) |
The spread is highlighted with a distinct color to draw attention to the main arbitrage metric.
APR (Annual Percentage Rate)
APR represents the annualized return you would earn if the current funding rate persisted for a full year. See the Formulas page for the exact calculation.
OI / Volume Bar
When Open Interest and Volume data is available, a horizontal bar appears showing per-exchange market data:
- OI (Open Interest) — displayed in formatted USD (e.g., $1.2M, $45K)
- Volume — 24h trading volume in formatted USD
- Each exchange's data is shown separately, divided by vertical separators
This helps you assess liquidity before entering a position — higher OI and Volume generally mean lower slippage.
Funding Chart
The interactive chart is the centerpiece of the analysis. See Funding Chart for full details on navigation, zoom, period presets, and exchange toggles.
Rate Table
Below the chart you will find a table listing every exchange where the ticker is available:
| Column | Description |
|---|---|
| Exchange | Exchange name |
| Funding % | Current funding rate for the analysis period |
| Role | Long (negative rate, you receive funding), Short (positive rate, you receive funding), or — |
- Exchanges are sorted by funding rate (ascending — best longs at the top)
- Color-coded: green for positive rates (Short), red for negative rates (Long)
The table makes it easy to evaluate which exchange pairs produce the best spread and to choose the optimal combination for your trade.
Entry Cost & PnL Estimation
The Analysis section below the chart provides tools for evaluating trade profitability:
- Entry Cost — shows spread, fees, and total cost of entering the position on each exchange
- PnL Estimation — projects cumulative profit over the selected period based on historical funding rates
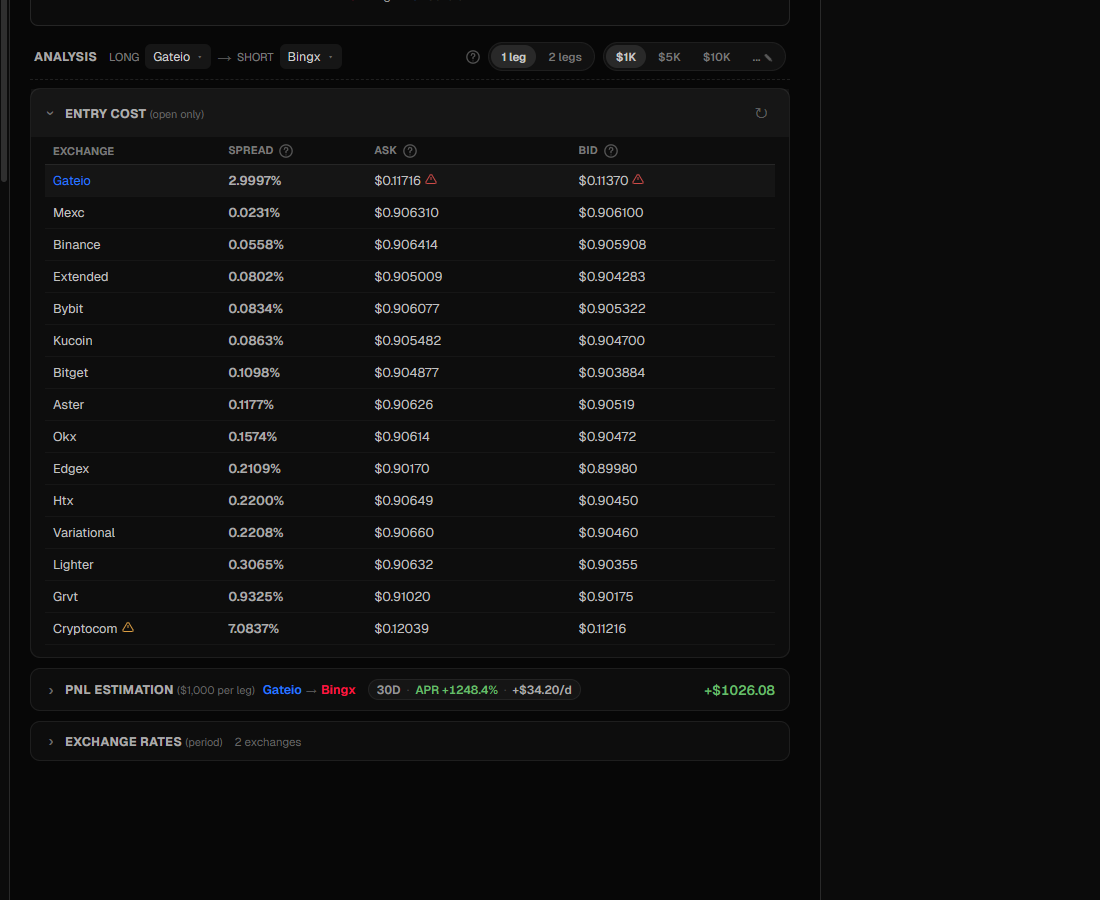
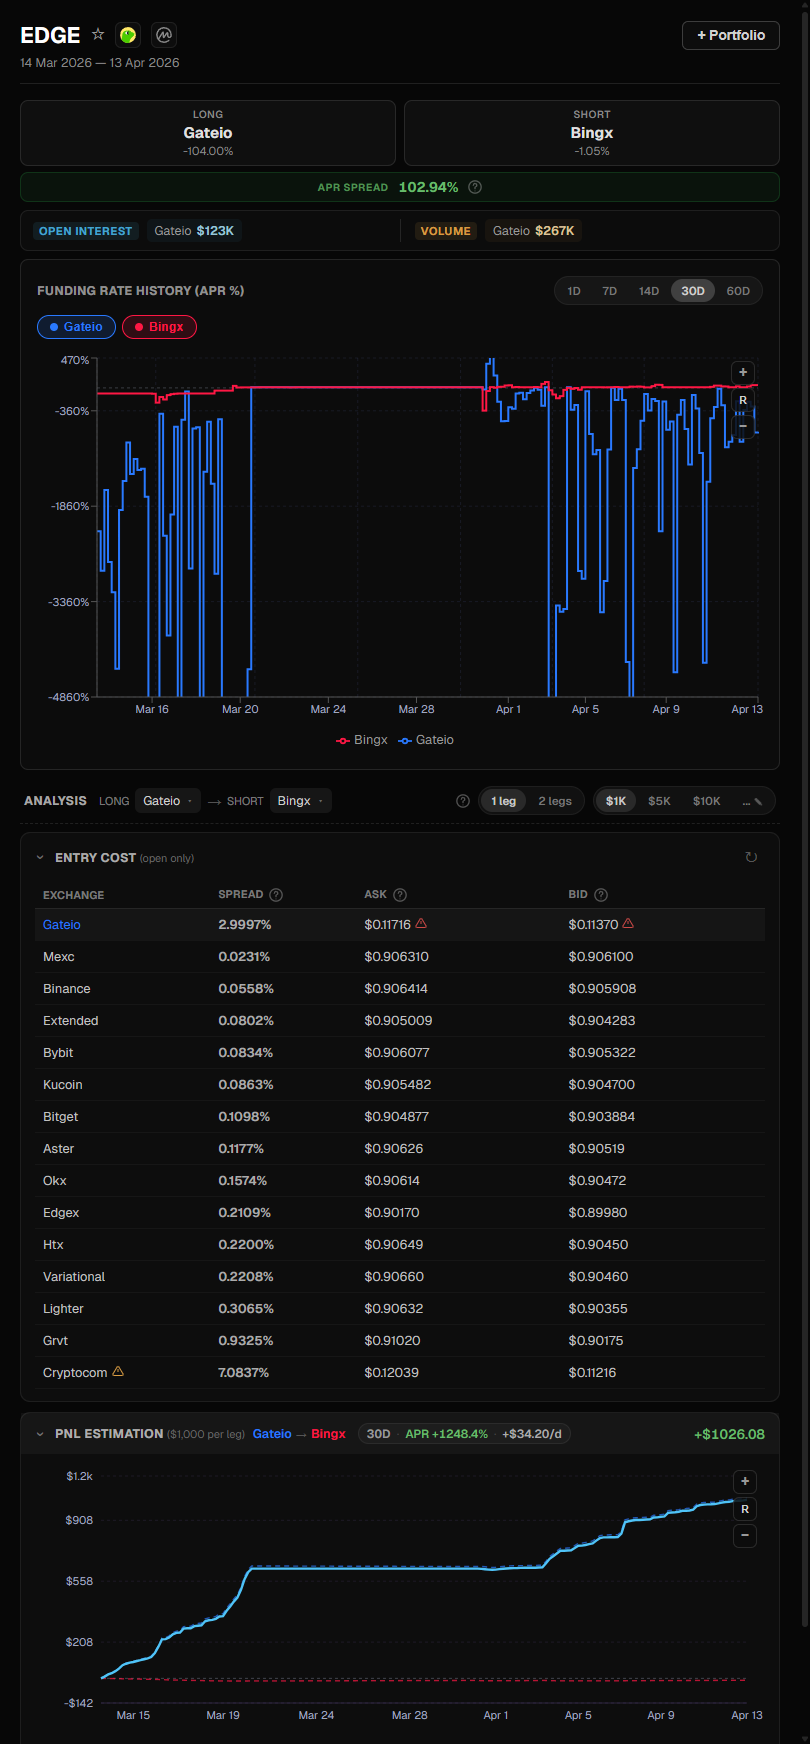
You can select different exchange pairs for analysis using the LONG and SHORT dropdowns, and toggle between 1-leg and 2-leg entry cost calculations. The amount presets ($1K, $5K, $10K) let you quickly estimate PnL at different position sizes.
Adding to Portfolio
Click the + Portfolio button to add the ticker to your portfolio. The form pre-fills:
- Long exchange — the exchange with the lowest (most negative) funding rate
- Short exchange — the exchange with the highest (most positive) funding rate
- Token price — automatically fetched from exchange APIs or CoinGecko
For more information on managing positions, see Position Management.
Shareable Links
The URL updates when you select a ticker, making it shareable:
https://funding-search.xyz?ticker=BTCUSDT&exchanges=binance,hyperliquid&start=2024-01-01&end=2024-01-31Send this link to anyone and they will see the same ticker with the same exchanges and date range.