
Getting Started
A step-by-step guide for your first time using Funding History Search.
Step 1. Open the Application
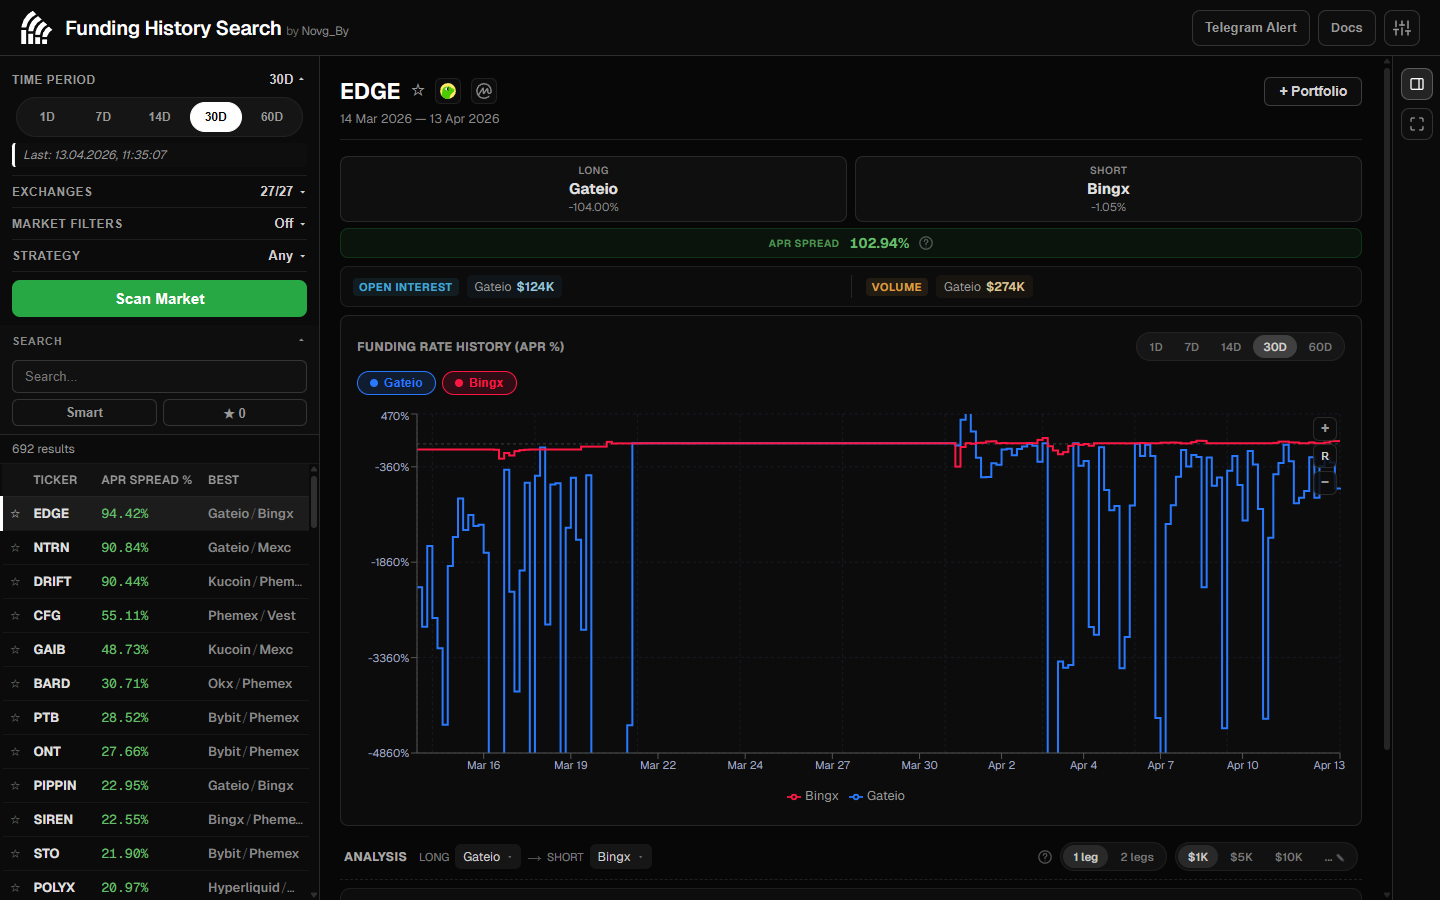
Navigate to funding-search.xyz. The interface is organized into three resizable panels:
| Panel | Location | Purpose |
|---|---|---|
| Scanner & Results | Left | Scan configuration and the list of discovered tickers |
| Ticker Details | Center | Chart, metrics, OI/Volume, and rate table for the selected ticker |
| Portfolio | Right | Position tracking, PnL, and closed position history |
Panels can be resized by dragging the dividers between them. Panel widths are saved between sessions.
Step 2. Configure the Scan
In the left panel:
- Select a period — click one of the presets:
1d,7d,14d,30d,60d, or set a custom date range - Select exchanges — check at least 2 exchanges, or click
Select All - Optionally: set market filters (minimum OI, minimum Volume) to exclude low-liquidity tickers
- Optionally: configure a strategy to fix one exchange and direction
Minimum 2 Exchanges Required
To calculate an arbitrage spread you need at least 2 exchanges. The spread is the difference between the highest and lowest funding rate across your selection.
Step 3. Run the Scan
Click the Scan Market button. The scanner will:
- Fetch historical funding data for all available tickers in a single bulk request
- Display elapsed time and a progress indicator
- Provide a cancel button if the scan takes too long
- Sort results by spread (best opportunities at the top)
Result Caching
Scan results are saved to localStorage. If you reopen the page with the same parameters, data will load instantly without another server request. The last scan time is displayed next to the period selector.
Step 4. Explore the Results
Each row in the results list shows:
- Favorite star — click to bookmark the ticker
- Symbol — the ticker name (e.g., ETHUSDT)
- Spread % — the funding rate difference between the best exchanges over the selected period
- Best Pair — the exchange pair offering the maximum spread (long / short)
Use the search box to filter by name, the favorites filter to see only bookmarked tickers, or the Smart Filter to show only stable, high-quality opportunities.
Click any ticker to open its detailed analysis in the center panel.
Step 5. Analyze the Ticker
The center panel shows:
- Metrics — total spread, best long exchange + APR, best short exchange + APR
- OI / Volume bar — Open Interest and trading volume per visible exchange
- Funding chart — interactive chart with per-exchange lines, period presets, Y-zoom, and range selection
- Rate table — all exchanges sorted by funding rate with Long/Short role labels
Step 6. Add a Position to the Portfolio
When you find a suitable ticker:
- Click + Portfolio in the center panel header
- The long and short exchanges are pre-filled with the best pair
- Fill in the amount (or token quantity — they auto-link based on price)
- Set the opening cost (fees + slippage) and entry date
- The position appears in the Portfolio on the right
Step 7. Track Your PnL
In the portfolio panel:
- Click ↻ Refresh to recalculate PnL for all positions using real historical funding data
- Click a position's PnL value to open the Fullscreen Portfolio with per-position PnL charts
- When you close a position, it moves to Closed Positions with its realized PnL preserved
Step 8. Set Up Notifications (Optional)
Click the bell icon in the top bar to connect your portfolio to a Telegram bot for alerts.
Next: Scan Setup — detailed guide on periods, exchanges, strategies, and market filters.